
The stock market, as measured by the S&P 500 Index , rallied off the support level at 4330 in mid-August, and things looked quite rosy for a while. But that rally may have just been an oversold reaction, and not the start of a new leg of the bull market, as the bulls had hoped.
Resistance developed just above 4500, and SPX has been declining since -– quite sharply on some days. So it is important to see whether SPX can break through that resistance at 4500 (and then break out over the further resistance at 4600) or whether it will fall below 4330. Either one should produce a strong directional move for SPX.
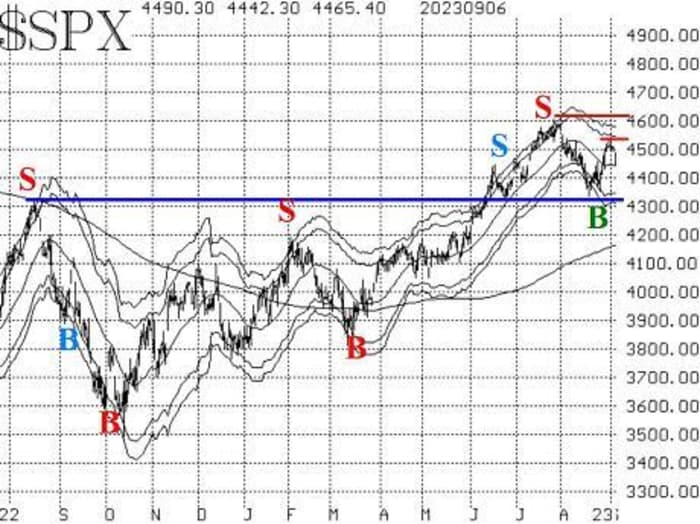
The McMillan Volatility Band (MVB) buy signal remains in place (green “B” on the accompanying SPX chart). Its target is the +4σ “modified Bollinger Band,” but the recent rally never quite got that far. This buy signal would be stopped out if SPX were to close below the -4σ Band, which is currently at 4300 — below the major support mentioned above.
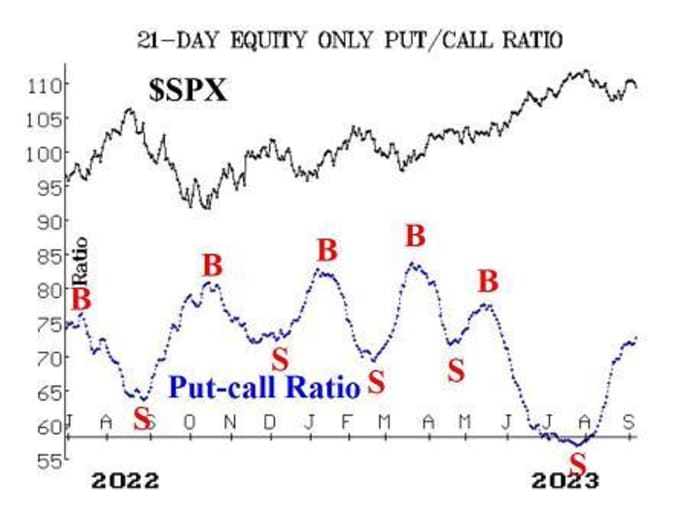
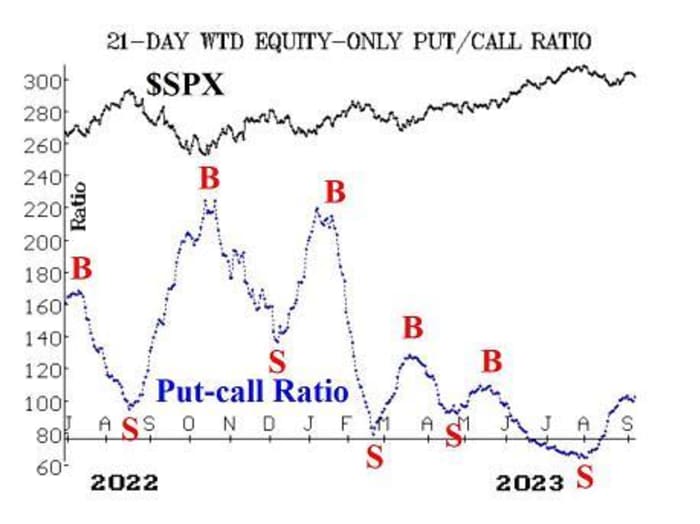
Equity-only put-call ratios remain on solid sell signals. They both moved sharply higher yesterday and are at new relative highs for the current move. As long as they are rising, that is bearish for the stock market in general. They won’t turn bullish until they roll over and begin to trend downward.
Breadth has deteriorated badly over the past few trading sessions. So, the buy signals that had been established on August 28th have already been stopped out and replaced by sell signals. This is our shortest-term indicator, and it is sometimes subject to these whipsaws. The previous sell signal, which began at the beginning of August, was a longer-lasting signal, but that has become more of the exception than the norm.
New 52-week Highs on the NYSE were taking control over New Lows for a period of time in late August. In fact, on one day there were more than 100 New Highs, and it appeared that this indicator might be ready to generate a buy signal. That did not happen, and now New Lows are outnumbering New Highs again. Even so, this indicator remains in a neutral status — awaiting two consecutive days of 100 New Lows or 100 New Highs in order to generate the next signal.
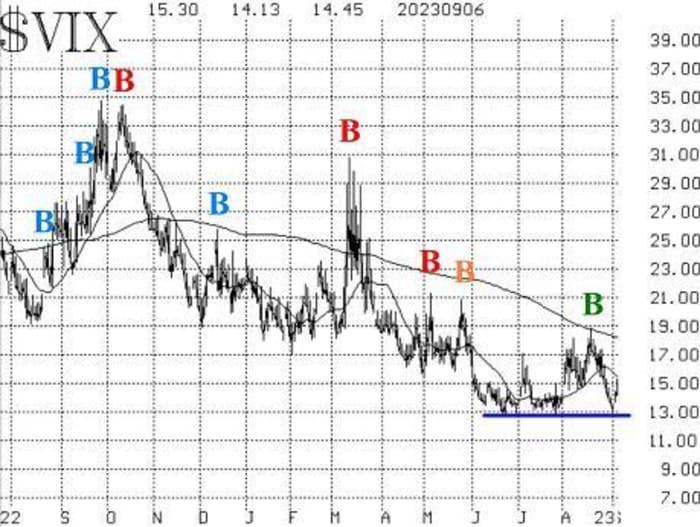
The above indicators are what we call “market internals,” and they present a somewhat negative picture. That is countered by the indicators based on VIX and volatility derivatives. VIX VX00 seems to have bottomed in the 13.0 area and probably isn’t going to go much lower (there is still some fear of the market among the market’s larger players). But VIX hasn’t jumped much higher, either. Thus, the “spike peak” and trend of VIX buy signals remain in place. The first sign of trouble would be VIX returning to “spiking” mode (that is a gain of at least 3.0 points, using closing prices, over any three-day or shorter time frame).
Finally, the construct of volatility derivatives continues to paint a bullish picture for stocks. The term structure of the VIX futures continues to slope upwards, as does that of the CBOE Volatility Indices. If the front-month September VIX futures were to rise above the price of October VIX futures, that would be a sharply negative indicator, but so far that has not been the case.
So as long as SPX remains above 4330, a bullish case can be made. In the short term, that case is coming under attack after the failure of the recent rally at the 4500 level. In any case, we will continue to trade confirmed signals around a “core” bullish position.
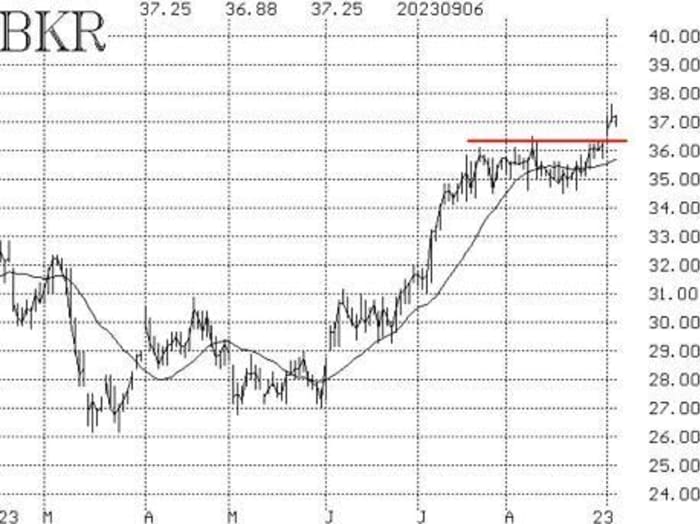
New call recommendation: Baker-Hughes BKR
BKR had a strong move upward in July and then spent most of August consolidating those gains. Now it has broken out again to the upside, accompanied by strong stock and option volume patterns.
Buy 4 BKR Oct (20th) 37 calls in line with the market.
BKR: 37.34 Oct (20th) 37 call: 1.65 bid, offered at 1.75
Set a trailing stop at 35.80, basis BKR common stock, for these calls.
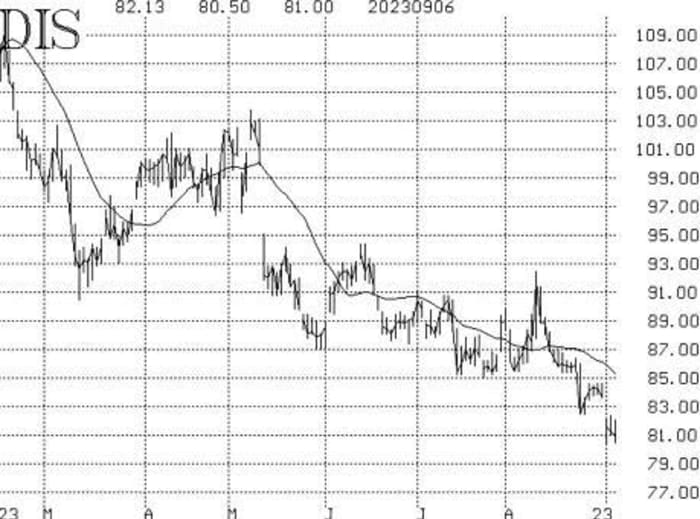
New put recommendation: Walt Disney DIS
DIS has broken down again and is close to its pandemic lows of March 2020. Until this trend can be reversed, a put purchase is viable.
Buy 4 DIS Oct (13th) 81 puts (note the expiration is the 13th, not the 20th) in line with the market.
DIS: 80.68 Oct (13th) 81 put: 2.56 bid, offered at 2.61
Stop out on a close above 83.70 by DIS.
Follow-up action:
All stops are mental closing stops unless otherwise noted.
We are using a “standard” rolling procedure for our SPY spreads: in any vertical bull or bear spread, if the underlying hits the short strike, then roll the entire spread. That would be roll up in the case of a call bull spread, or roll down in the case of a bear put spread. Stay in the same expiration and keep the distance between the strikes the same unless otherwise instructed.
Long 2 SPY Sept (15th) 456 calls: This is our “core” bullish position. The calls have been rolled several times. Roll up every time your long SPY option is at least 6 points in-the-money.
Long 0 VTRS VTRS Sept (15th) 11 calls: These calls were stopped out on September 5th, when VRTS closed below 10.75.
Long 8 CRON CRON Sept (15th) 2 calls: Hold these calls without a stop while the takeover rumors play out.
Long 6 ORIC ORIC Sept (15th) 7.5 calls: The stock is strong, as it made a new yearly high yesterday. Raise the stop to 8.40.
Long 2 EW EW Sept (15th) 77.5 puts: Hold these puts as long as the weighted put-call ratio remains on a sell signal.
Long 4 SPY Sept (29th) 480 calls: This is the position taken in line with the CVB buy signal. We are holding SPY calls with a striking price equal to SPY’s all-time high. We will hold without a stop initially.
Long 1 SPY Sept (15th) 448 put and Short 1 SPY Sept (15th) 418 put: Bought in line with the equity-only put-call ratio sell signals. We will stop ourselves out of this trade if either equity-only put-call ratio moves to a new buy signal.
Long 2 NTAP NTAP Oct (20th) 80 puts: Hold this position as long as the weighted put-call ratio for NTAP remains on a sell signal.
Long 2 EQR EQR Oct (20th) 65 puts: Bought at the close on Aug 15 when EQR closed below 64.50. We will continue to hold as long as the weighted put-call ratio for EQR remains on a sell signal.
Long 3 X X Sept (15th) 31 calls: Hold while the takeover rumors play out.
Long 2 PSX PSX Sept (15th) 115 calls: Hold while the activist investor rumors play out.
Long 1 SPY Oct (20th) 446 call and Short 1 SPY Oct (20th) 464 call: This spread was bought in line with the MVB buy signal of August 29th. This signal will remain in place unless SPX closes below its -4σ Band, which would stop out the signal. The target for the trade is for SPX to touch the +4σ Band.
Long 3 ADM ADM Oct (20th) 82.5 puts: Hold this position as long as the weighted put-call ratio for ADM is on a sell signal.
Long 1 SPY Sept (29th) 451 call: Bought in line with the breadth oscillator buy signals of late August. Since those signals are no longer bullish, these calls should be sold.
Long 5 TSHA TSHA Oct (20th) 2.5 calls: Raise the stop to 2.60.
All stops are mental closing stops unless otherwise noted.
Send questions to: lmcmillan@optionstrategist.com.
Lawrence G. McMillan is president of McMillan Analysis, a registered investment and commodity trading advisor. McMillan may hold positions in securities recommended in this report, both personally and in client accounts. He is an experienced trader and money manager and is the author of the best-selling book, Options as a Strategic Investment. www.optionstrategist.com
©McMillan Analysis Corporation is registered with the SEC as an investment advisor and with the CFTC as a commodity trading advisor. The information in this newsletter has been carefully compiled from sources believed to be reliable, but accuracy and completeness are not guaranteed. The officers or directors of McMillan Analysis Corporation, or accounts managed by such persons may have positions in the securities recommended in the advisory.